munin-plugin-couchdb is the Munin plugin that allows to monitor Apache CouchDB instance.
First of all, ensure that your system has installed Perl 5.12+ and two additional libraries: LWP::UserAgent and JSON. Sure, you would also need to have Munin installed.
The plugin installation is quite trivial operation
git clone https://github.com/gws/munin-plugin-couchdbcp munin-plugin/couchdb_ /etc/munin/plugins- Read the docs via
perldoc couchdb_ - Create
/etc/munin/plugin-conf.d/couchdband setup proper configuration - Check that it works:
su munin -c '/usr/sbin/munin-run couchdb_'
For additional information about plugins installation consult with Munin docs.
The munin-plugin-couchdb is able to gather statistics not only
from /_stats resource (which doesn't requires any authentication by
default unless require_valid_user is set on) but also from other
resources like /_active_tasks which requires to provide CouchDB server
administrator's credentials.
Leaving such credentials in plain text within config file is dangerous, so make sure that plugin's configuration file is readable only for trusted users.
If you're going to monitor remote server (not on localhost) make sure that you're using secure connection with it (HTTPS or SSH-tunnel) to not transfer credentials in plain text over the network.
These metrics are related to Mochiweb - the CouchDB's HTTP server which runs the API and communicates with the world.
This plugin also gathers all metrics from CouchDB via HTTP API, so it causes
so overhead: one request to fetch max_dbs_open from /_config resource,
one request to fetch all stats from /_stats, 3 more requests (by default)
for couchdb_request_times graph per each sample and optional request to
/_active_tasks if allowed plus one per each monitored database. In total
at least 6 requests per stats update.
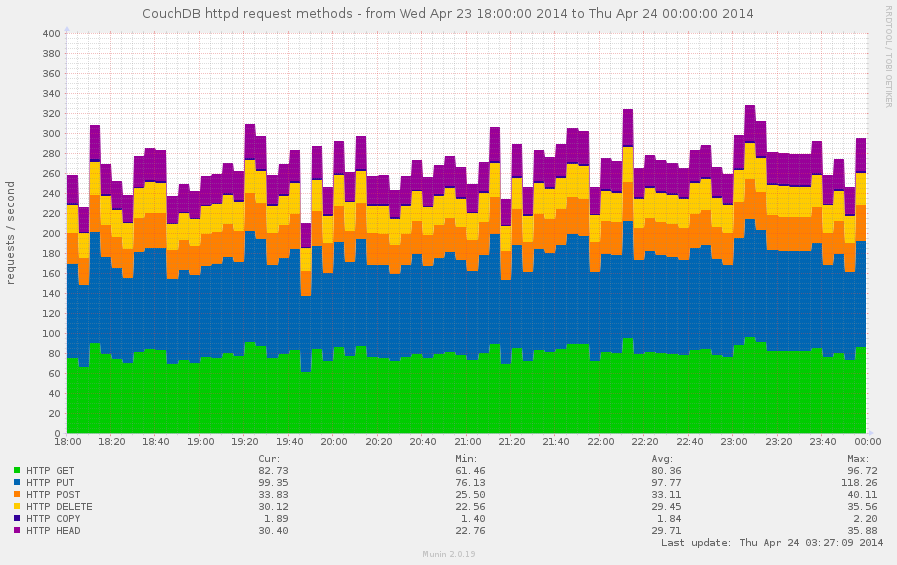
The couchdb_httpd_request_methods graph provides information about all HTTP
requests in context of used method. It counts the next methods:
HEADGETPOSTPUTDELETECOPY
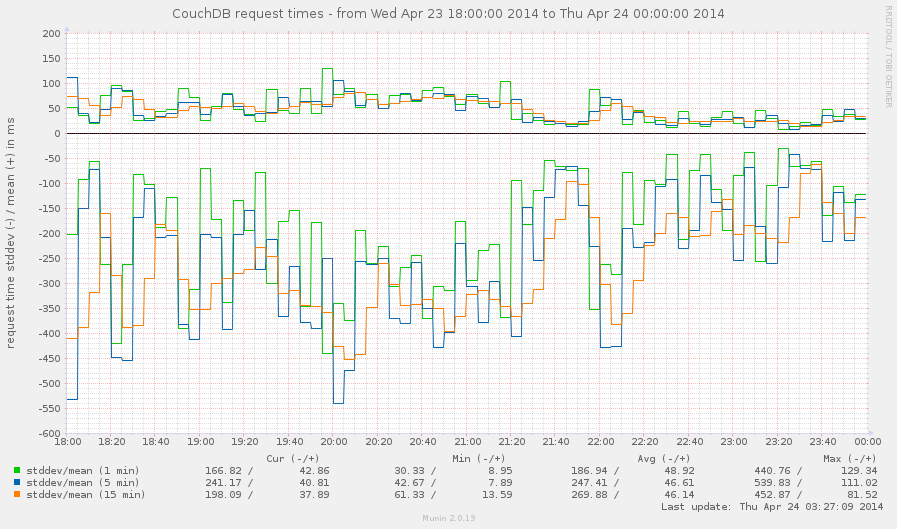
The couchdb_request_times graph shows stddev/mean of HTTP request time within
each sampling range.
In CouchDB configuration information isn't available, the default samples
([60, 300, 900]) will be used. Note, that in this case for each sample that
doesn't match value defined in stats/samples option this graph will
print zeros.
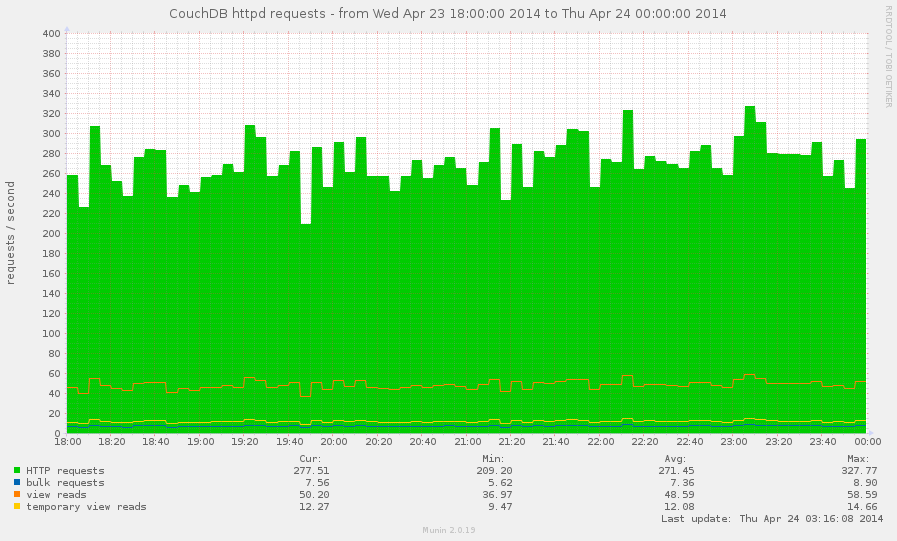
The couchdb_httpd_requests graph shows rate of HTTP requests in context of
their type:
HTTP requests: overall amount of HTTP requestsbulk requests: how often were used bulk updatesview reads: amount of requests to the view indexestemporary view reads: amount of requests to the temporary view indexes
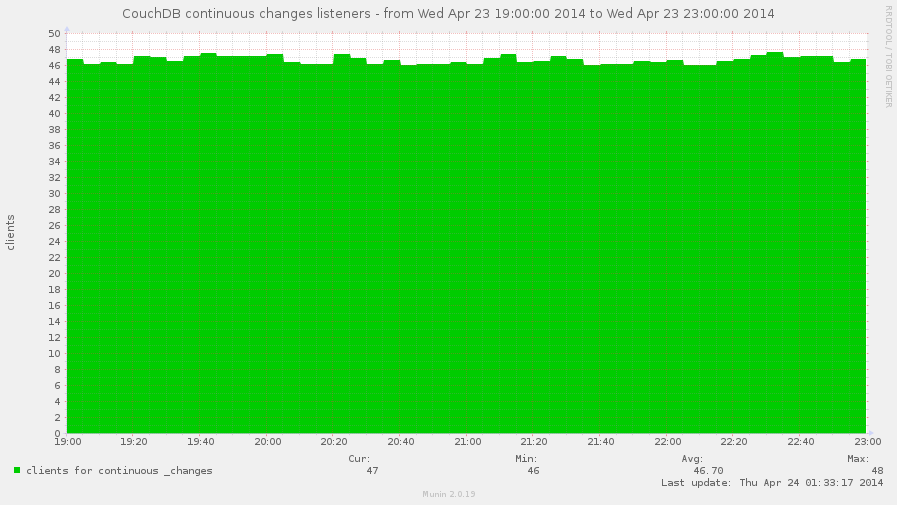
While clients_requesting_changes metric is in the same group as
bulk_requests, temporary_view_reads and others,
the couchdb_clients_requesting_changes graph shows not requests rate, but
the current amount of active clients to continuous changes feeds.
This graph also helps to roughly estimate amount of continuous replications that are running against monitored instance.
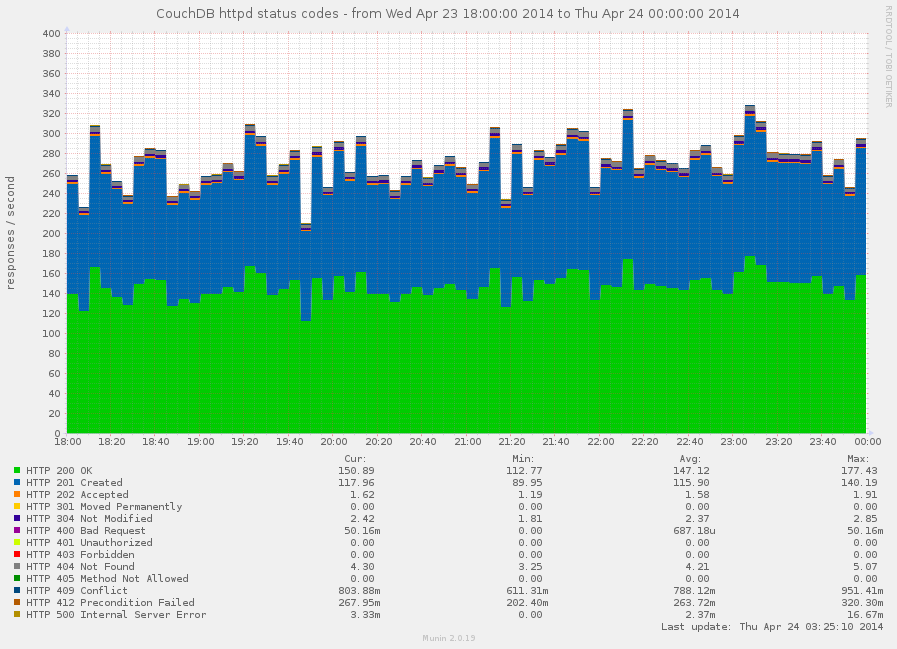
The couchdb_httpd_status_codes graph provides information about HTTP
responses in context of status code.
Keeping eye on amount of HTTP 4xx and 5xx responses helps you provide
quality service for you users. Normally, you want to see no 500 errors at all.
Having high amount of 401 errors could say about authentication problems
while 403 tell you that something or someone actively doing things that he's
shouldn't do.
These metrics are related to whole server instance.
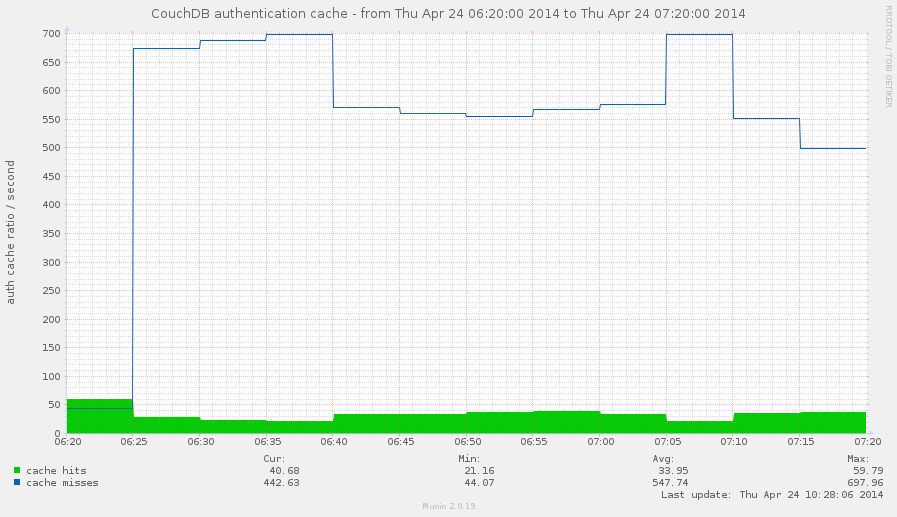
The couchdb_auth_cache graph shows rate of authentication cache hits/misses.
CouchDB keeps some amount of user credentials in memory to speedup authentication process by elimination of additional database lookups. This cache size is limited by the configuration option auth_cache_size. On what this affects? In short, when user login CouchDB first looks for user credentials what associated with provided login name in auth cache and if they miss there then it reads credentials from auth database (in other words, from disk).
The auth_cache_miss metric is highly related to HTTP 401 responses one,
so there are three cases that are worth to be looked for:
-
High
cache missesand high401responses: something brute forces your server by iterating over large set of user names that doesn't exists for your instance -
High
cache missesand low401responses: yourauth_cache sizeis too small to handle all your active users. try to increase his capacity to reduce disk I/O -
Low
cache missesand high401responses: much likely something tries to brute force passwords for existed accounts on your server
Note that "high" and "low" in metrics world should be read as "anomaly high" and "anomaly low".
Ok, but why do we need auth cache hit then? We need it as an ideal value to compare misses counter with. Just for instance, is 10 cache misses a high value? What about 100 or 1000? Having cache hits rate at some point helps to answer on this question.
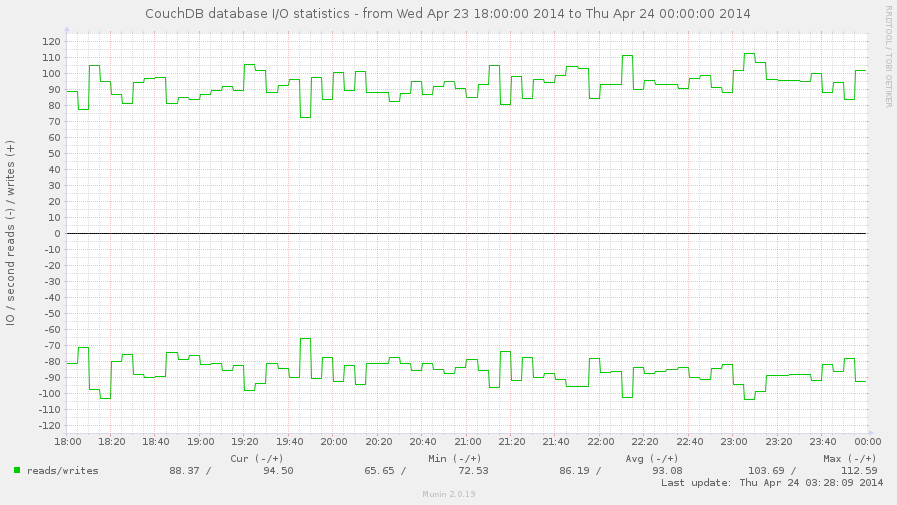
The couchdb_database_io graph shows overall databases read/write rate.
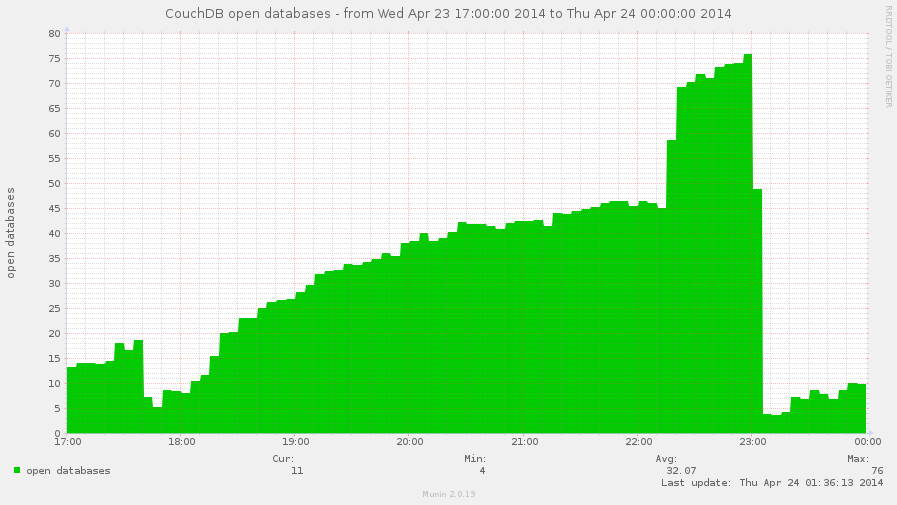
The couchdb_open_databases graph shows amount of currently opened databases.
CouchDB only keeps opened databases which are receives some activity: been
requested or running the compaction. The maximum amount of opened
databases in the same moment of time is limited by max_dbs_open
configuration option. When CouchDB hits this limit, any request to "closed"
databases will generate the error response: {error, all_dbs_active}.
However, once opened database doesn't remains open forever: in case of
inactivity CouchDB eventually closes it providing more space in the room for
others, but sometimes such cleanup may not help. This graph's goal is to help
you setup correct max_dbs_open value that'll fit your needs.
Notice: If server administrator's credentials provided (need to request
/_config resource) the max_dbs_open configuration value will be used to
set proper warning and critical levels.
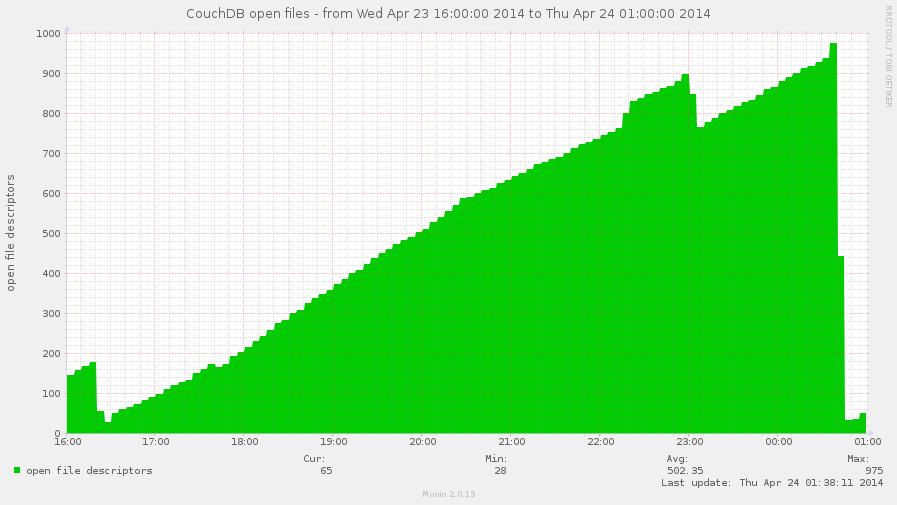
The couchdb_open_files graph shows amount of currently opened file
descriptors.
Notice: Handling system nofile limit isn't implemented yet and couldn't be
possible for remote instances.
Warning: this graph is disabled by default. To enable it you should
set env.monitor_active_tasks yes in plugin configuration file and also
provide CouchDB server administrator user. See Setting Auth Credentials
section above for recommendations.
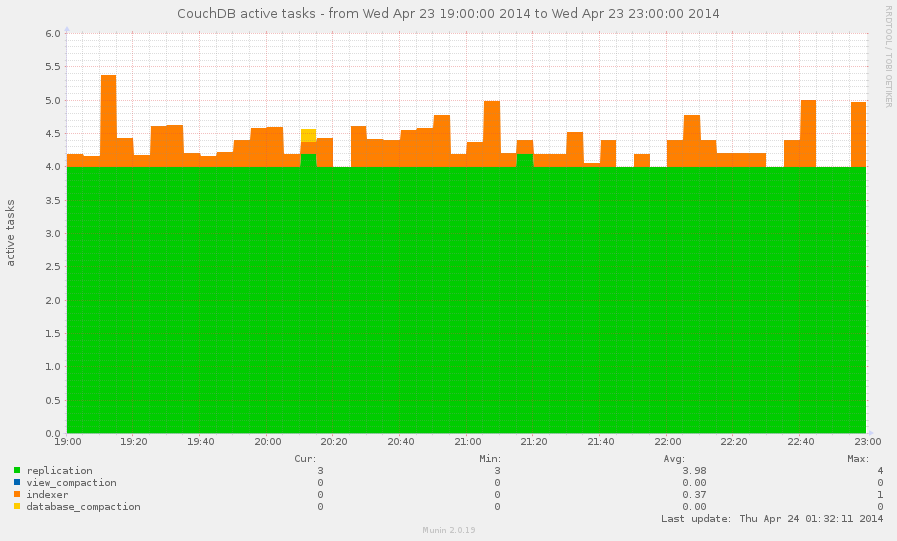
The couchdb_active_tasks graph shows current processes that runs on CouchDB:
- Active replications, served by this CouchDB instance
- View index builds
- Database and views compactions
This information is very valuable since some of these operations are very IO
heavy (compactions are so). For instance, you're looking on diskstats_iops
graph and see high write activity, but for most cases you could say for sure
who generates it. Combining these graphs together for the same period may
give you the answer is this activity is related to CouchDB and how if it is.
Warning: these graphs are disabled by default. To enable them you should
set env.monitor_users yes in plugin configuration file and also
provide CouchDB server administrator user. See Setting Auth Credentials
section above for recommendations.
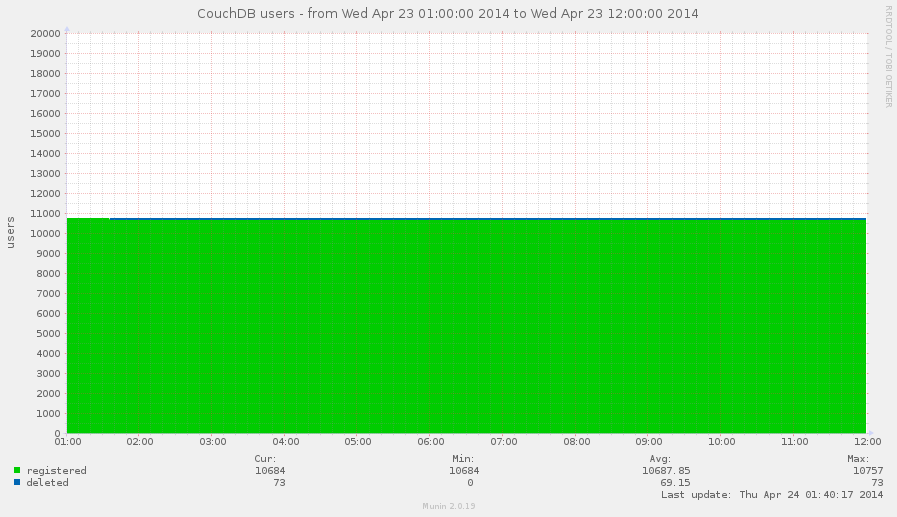
The couchdb_users and couchdb_admin_users graphs shows total amount of known
users by CouchDB.
The couchdb_admin_users graph is stand alone to easily track amount of server
administrators. In most time their number is stable and any unexpectable changes
may be a sign for worry about server security.
The couchdb_users graph shows users from authentication database and
tracks registered and deleted amount of them. This helps to estimate size of
your users database growing and decreasing in time.
munin-plugin-couchdb also allows to monitor few databases metrics that could
be useful. To enable it you need to set env.monitor_databases yes variable
in your plugin's configuration file and explicitly define list of databases
which would be monitored in env.databases. For example:
[couchdb]
env.uri    http://localhost:5984
env.username  admin
env.password  s3cR1t
env.monitor_databases  yes
env.databases  mailbox, db/with/slashes, data+ba$ed
Note, that user for provided credential should have read access to the specified databases to request database information from them.
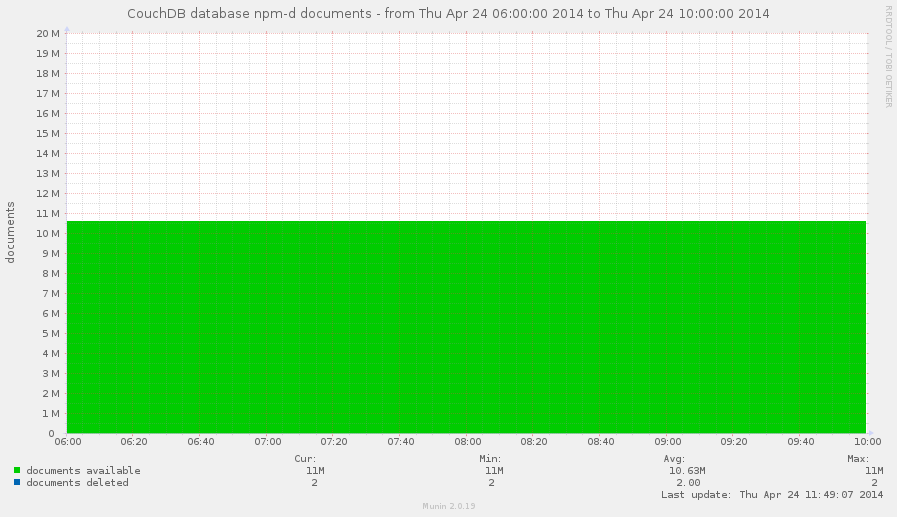
The couchdb_db_${dbname}_docs graph shows amount of existed and deleted
documents in specific database.
CouchDB doesn't physically removes documents on DELETE leaving tombstone
instead to be able replicate this information to others databases and to prevent
accidental "resurrection" of such documents during push replication.
However, when amount of deleted documents becomes significantly greater than existed ones, this may seriously affect on consumed disk space. Such "graveyard databases" are needed in cleanup from deleted documents (in case when it's ever possible) and this graph helps to detect them.
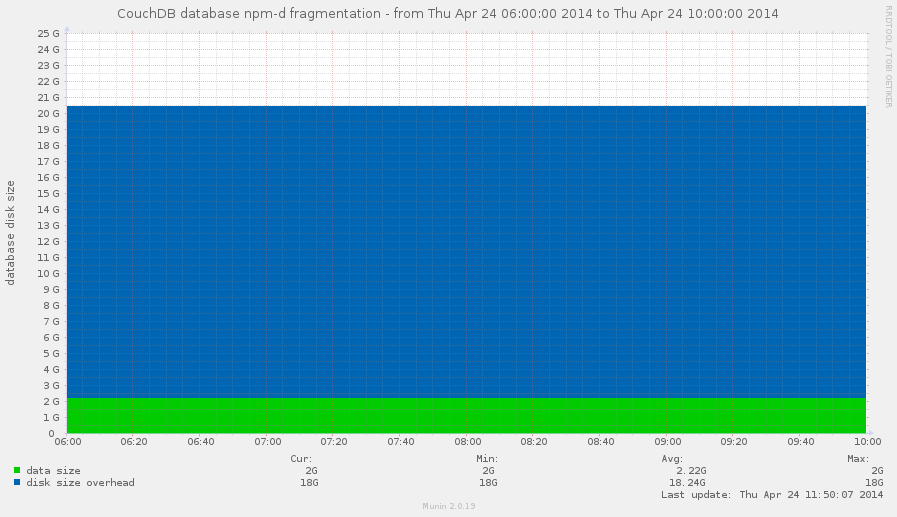
The couchdb_db_${dbname}_frag graph tracks database disk_size grow in time
and overhead caused over data_size.
Databases are needs to be compacted from time to time to retain used disk space by old documents revisions, but it's hard to note when compaction is worth to run especially since it's heavy disk I/O operation: you probably wouldn't compact 1TiB database just to free 20GiB. This graph helps to find answers on these two questions: "when?" and "how much?".
